On this page
- The scenario
- Step 1: Set up testing
- Step 2: Run the suite from Test runs
- Step 3: Read the results and diagnostics
- Step 4: Check coverage and preview the build
The scenario
You’re working on a project without a reliable safety net, and you want one before shipping changes: a test suite you can run on demand, coverage you can track, build previews to confirm the app actually runs, and clear diagnostics when something breaks. This walkthrough sets all of that up in Test Center and runs it end to end.Step 1: Set up testing
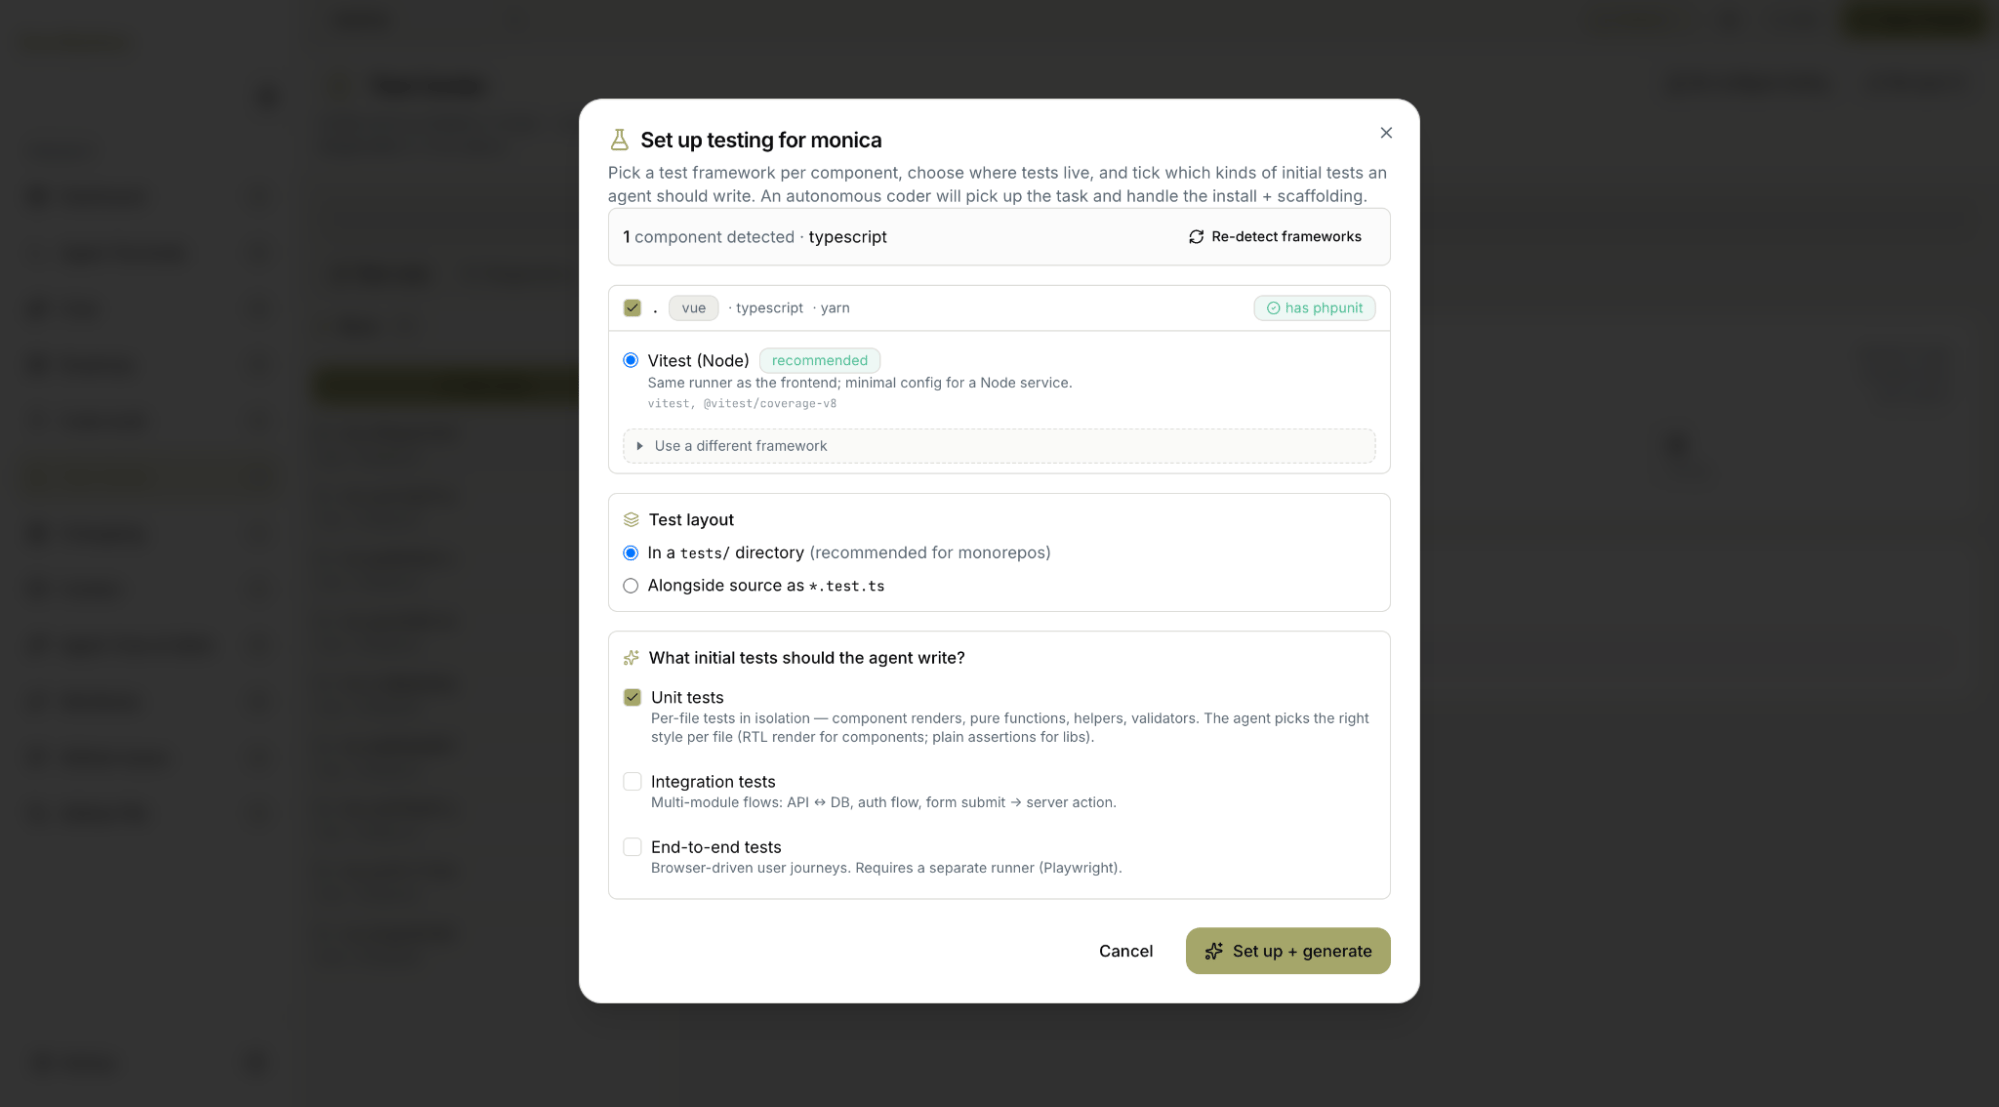
Open Test Center from the sidebar. Test Center brings builds, tests, coverage, logs, and broken-build diagnostics into one place. If the project doesn’t have testing configured yet, start with the setup wizard. It detects your project’s components and recommends a test framework for each (which you can override), lets you choose where tests live (atests/ directory or alongside the source), and lets you tick which kinds of initial tests to generate — Unit, Integration, or End-to-end. Press Set up + generate and an autonomous agent handles the install, scaffolding, and writing those first tests, so even a project starting from nothing ends up with a working test setup.
Once testing is configured, the wizard becomes Re-configure testing, and Re-sync CI regenerates the GitHub Actions workflows from the latest DevStation templates and opens a pull request.
Step 2: Run the suite from Test runs
With testing configured, open the Tests tab and its Test runs view, then press Run tests to execute the suite. Each run is recorded in the list with an identifier, a quick pass summary, and a timestamp, so you build up a history you can return to. Re-running is a single click whenever you want to re-verify after a change.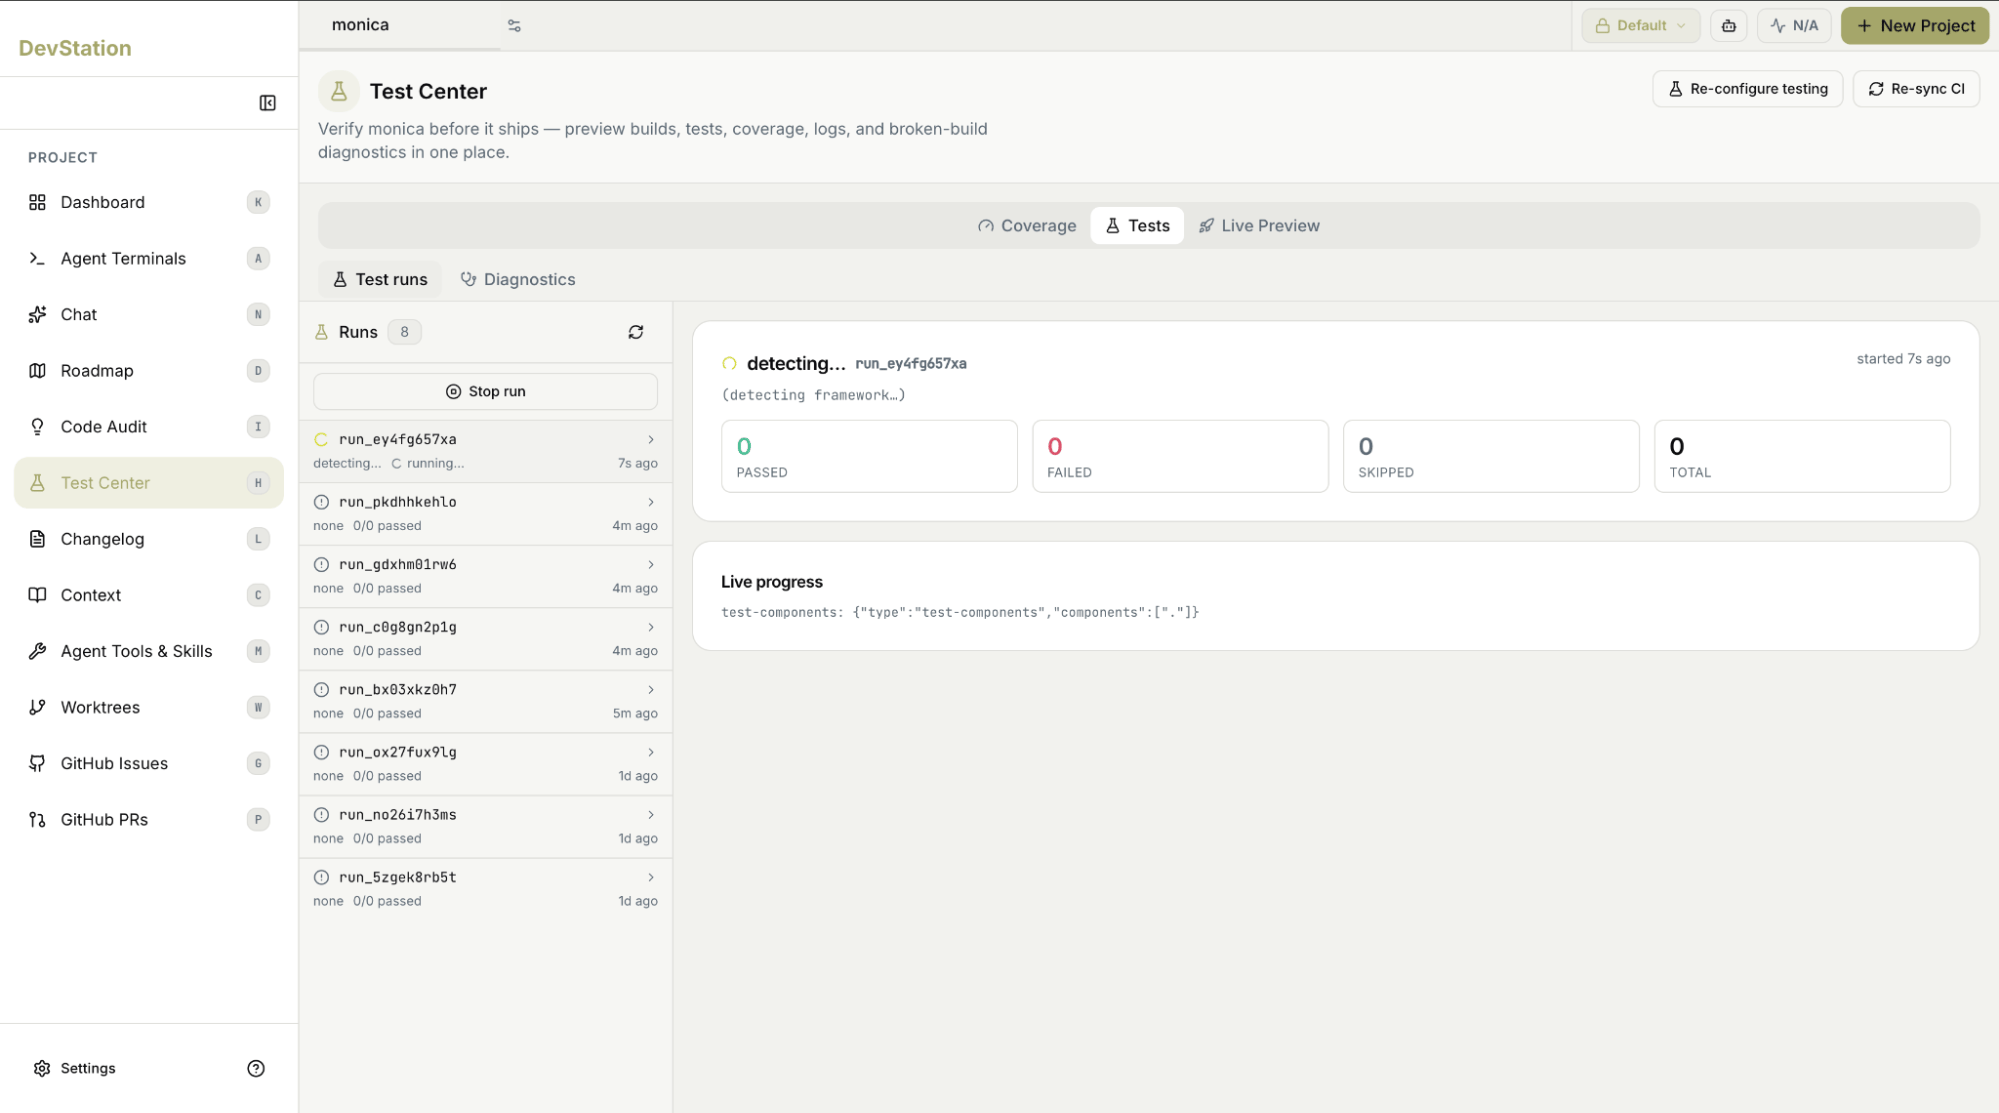
Step 3: Read the results and diagnostics
Select a run to open its detail. The run header shows whether it passed, along with when it started, how long it took, and its exit code; metric cards break the outcome down into Passed, Failed, Skipped, and Total. Beneath them, Full output gives you the raw test log to read line by line. When a build or run breaks, switch to the Diagnostics view (alongside Test runs) for an analysis of what went wrong — so you can go from a red run to a root cause without hunting through logs elsewhere.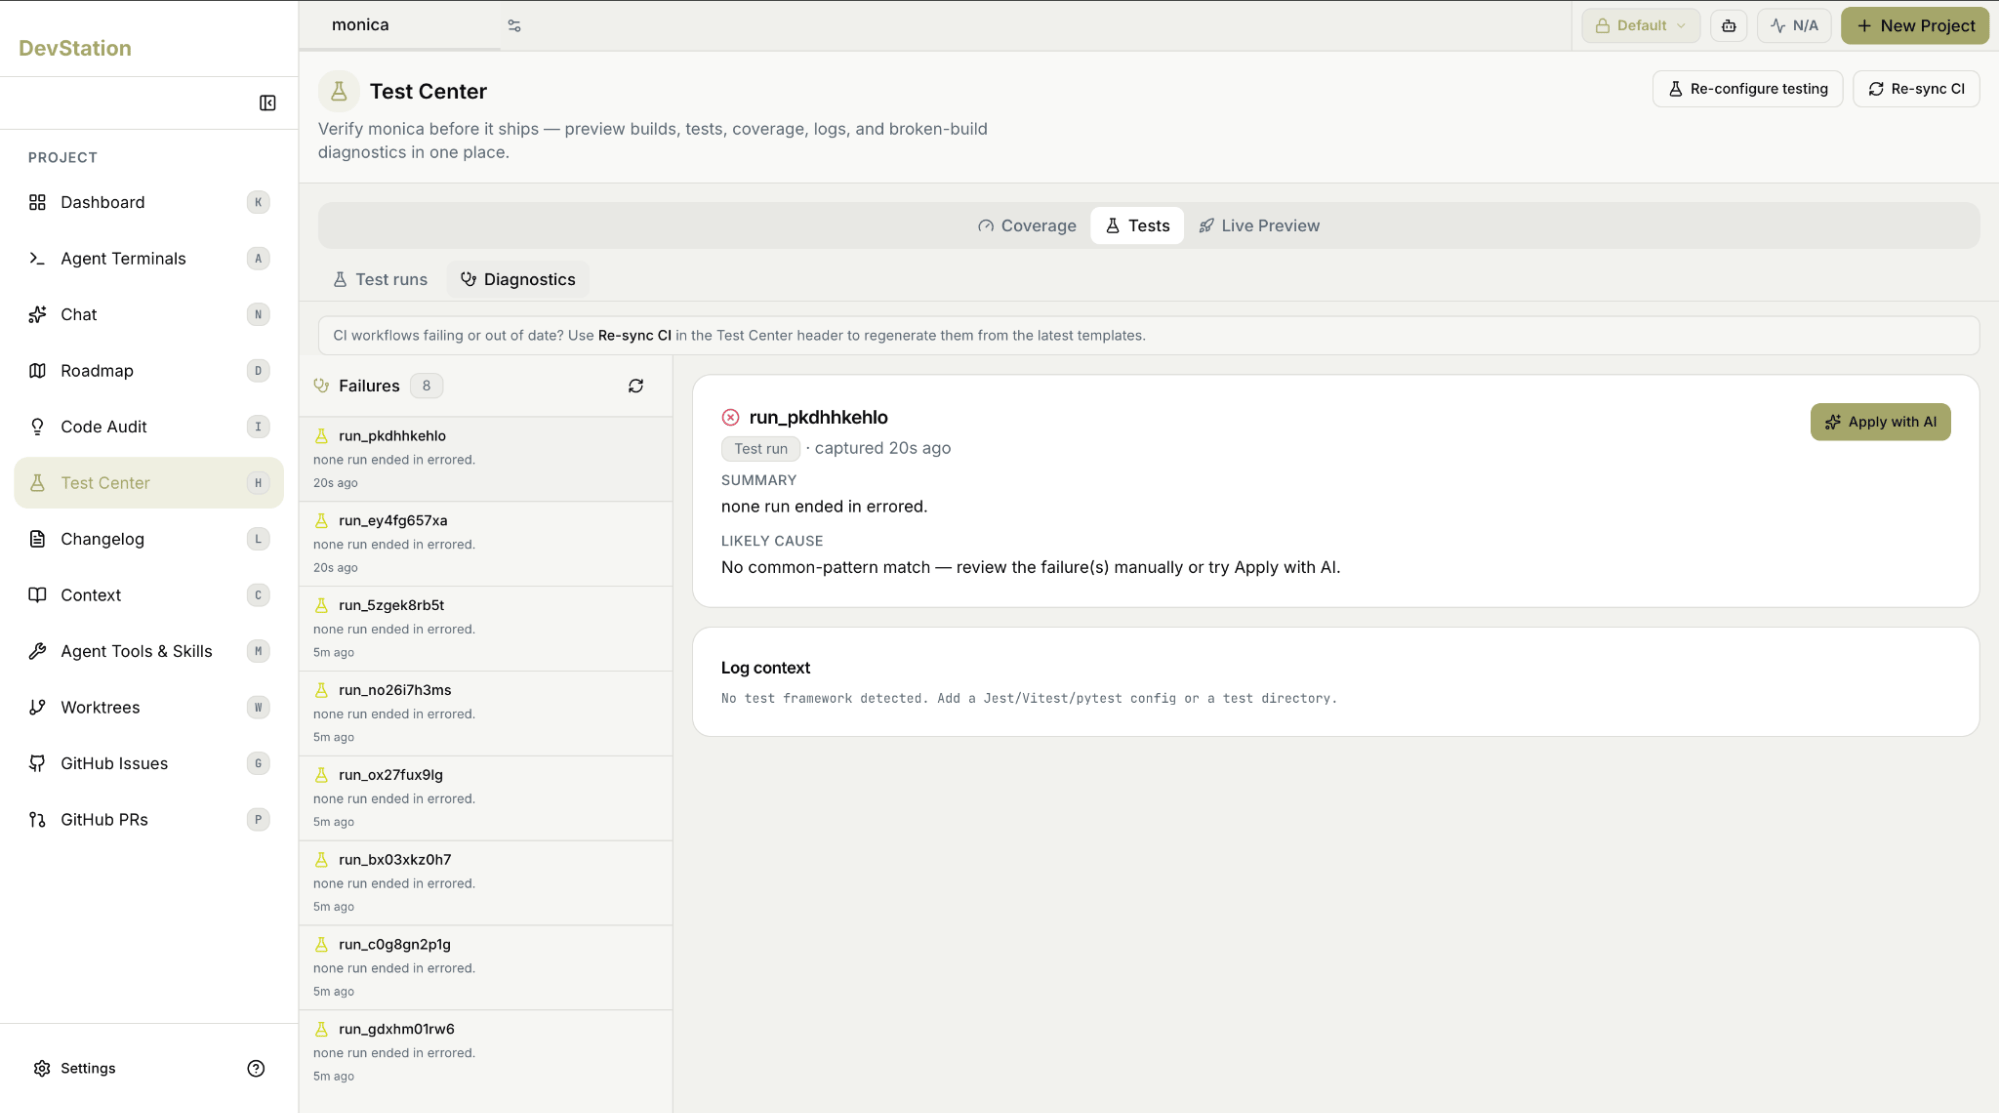
Step 4: Check coverage and preview the build
Switch to the Coverage tab to see how much of the codebase your tests exercise. Because the runner uses your framework’s native coverage flags, the report here is parsed automatically from a run with coverage enabled — no extra wiring. Use it to find untested areas and to track the number over time as you add tests. Finally, open Live Preview to see the built application itself, confirming not just that tests pass but that the build actually runs. Together, Coverage and Live Preview round out the picture: tests green, coverage visible, build verified.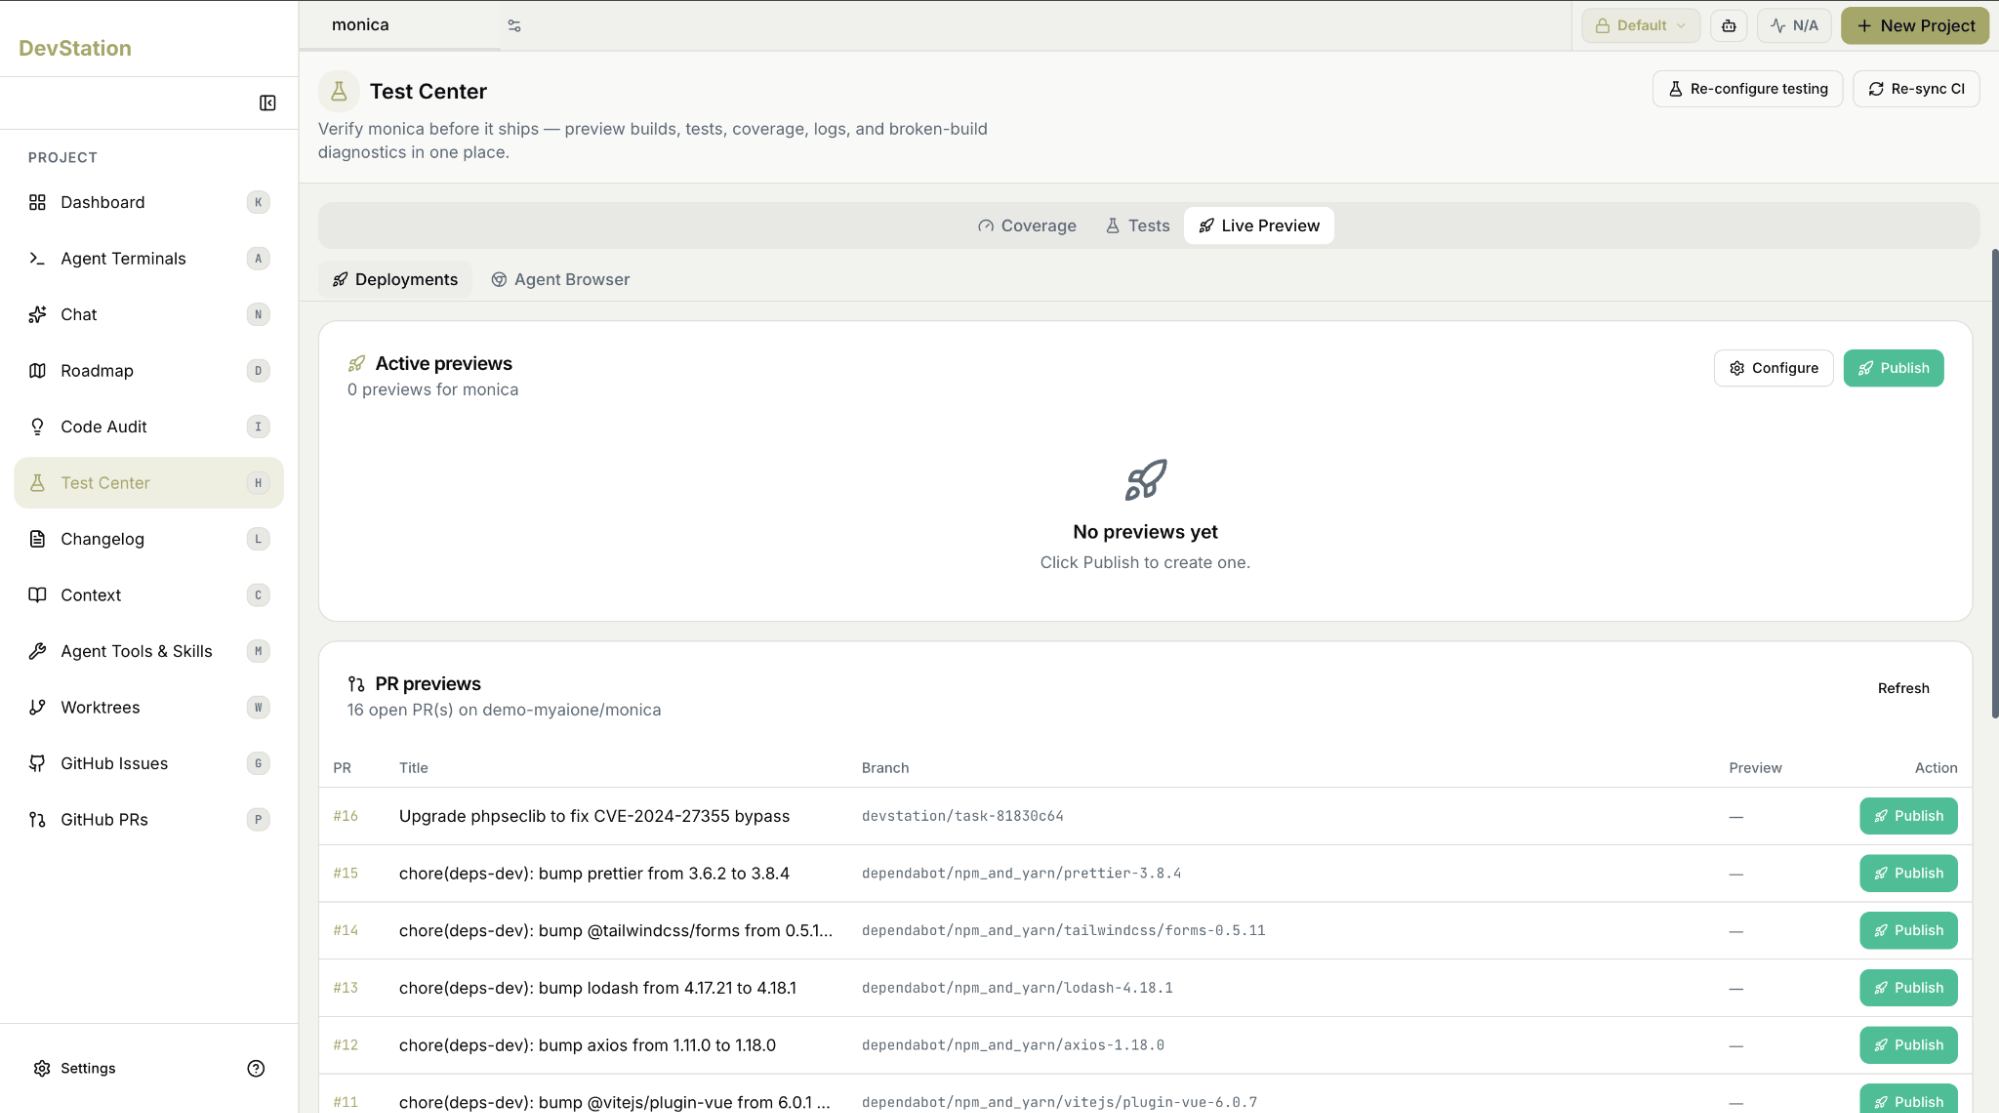
Starting from a project with little or no verification, you’ve configured testing through the wizard (an agent scaffolding the framework and writing the first tests), run the suite and read its results, diagnosed failures in one place, and confirmed coverage and a working build — a safety net you can re-run on every change.